Another Post in Our Series of DIY Consulting Tools We Share Every Other Tuesday!
 A Cause-Effect Diagram can help you understand the complex relationship between an effect (a problem or goal) and its causes. You can use this diagram to improve problem solving.
Groups using brainstorming techniques produce the most effective Cause-Effect Diagrams.
Overview
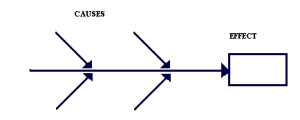 The effect is written on the right side of the diagram and a horizontal line is drawn from it to the left side of the chart. Categories of causes are put on diagonal lines feeding into the horizontal line. Its fishbone shape gives the Cause-Effect Diagram the name “fishbone diagram.”
Causes can fall into whatever categories the group feels are appropriate. The six (6) commonly selected categories are Management, Equipment (Machinery), Material, People, Process (Methods), and Environment. Other categories could be Information, Performance Standards (Quality, Cost, and Schedule), Facilities, and Training and Knowledge. Each major category might, in turn, have numerous causes and contributing factors.
How To Use This Tool
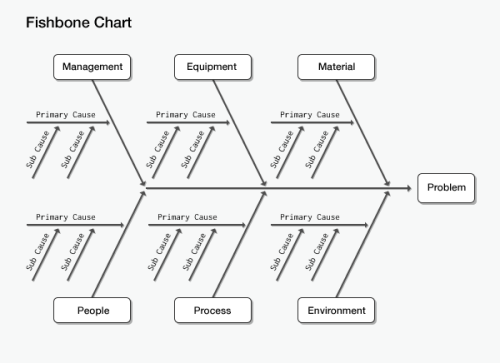 Here’s a Fishbone (Cause-Effect) template you can use to analyze the cause and effect of any business problem you are experiencing.
- Clearly state the problem or goal.
- Identify three to six major categories of causes.
- Brainstorm to fill in primary causes under each category; connect each primary cause to the major category line.
- Brainstorm sub causes that could contribute to each primary cause; position them on a line from the cause.
- Discuss each sub cause and how it might contribute to the primary cause. List this information next to the sub cause.
- Reach a consensus on the most likely causes and circle them. Look for causes that appear repeatedly.
- Agree on steps to take either to collect data verifying causes or to eliminate causes through corrective action.
Use this tool when
- You need to identify as many causes of a problem or goal as possible.
- You want to identify areas in which to gather more data.
To Learn More
We recommend the following book for those interested in learning more.
- Guide to Quality Control by K. Ishikawa.
Helpful Hints
- Make sure group members agree on and understand the effect (problem or goal).
- Position the fish bone diagram so all group members can see and contribute to it. A large piece of paper or “copy board” that can print copies for members is ideal.
- Consider anything that might explain the effect. Don’t evaluate ideas while generating possible causes.
- Facilitate the discussion by asking specific who, what, when, where, how, and why questions. For example, you might ask, “What in Machinery could be causing the problem”? “Why do you think the air compressor might be a cause”? “How do you think the oil could leak from the compressor”?
- Add to the diagram even after the end of the meeting. Considering the diagram later can uncover crucial ideas.
- Spend time between meetings gathering any additional information you need. Use forms such as check-sheets (a tool we’ll be covering in future posts) to collect information quickly.
 About the Author:
Gabriel Najera is the president & founder of the Najera Consulting Group. Gabriel is a frequent speaker to organizations. And, is a highly sought after advisor to corporate and nonprofit executives looking to develop a strategic thinking mindset.
Gabriel is the author of the forthcoming book, Lessons From the Field: From Farmworker to Fortune 500 Consultant. Gabriel is available to speak to your organization. To inquire about scheduling Gabriel for an upcoming speaking engagement or to inquire about our consulting services, please click on this link.










Sorry, the comment form is closed at this time.