Another Post in Our Series of DIY Consulting Tools We Share Every Other Tuesday!
 It’s been said that the three most difficult things to get people to do are 1) to think; 2) to do things in order of importance, and: 3) to focus.
So, how do you overcome these challenges? Najera Consulting suggest applying the Pareto Analysis tool also known as the 80/20 rule.
In 1937, Dr. Joseph Juran coined the term “Pareto Principle,” which millions of managers have since relied on to help separate the “vital few” from the “useful many” in their activities.
Dr. Duran based this principle on the research of Vilfredo Pareto’s a 19th century Italian economist. Pareto concluded that for many phenomena, 80% of consequences stem from 20% of the causes.
In other words, 20% of our time produces 80% of the results, 20% of the products bring in 80% of the profit, 20% of our work gives us 80% of our satisfaction or, 20% of an article gives 80% of the impact. (I’ve got a few percent to go — hang in there with me!)
“If you spend your time, energy, money and personnel on the top 20% of your priorities the result is a four-fold return in productivity.”
Overview of Tool
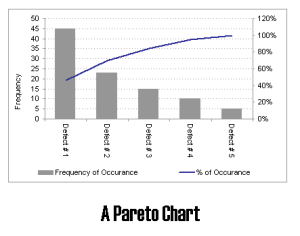
When you need to focus on the most serious problems or causes of a problem, use a Pareto chart to rank information. A Pareto chart usually lists information in terms of cost, percentage, or frequency and displays it in a vertical bar graph format. You can use Pareto charts to set priorities in problem solving or to assess improvement in “before and after” situations.
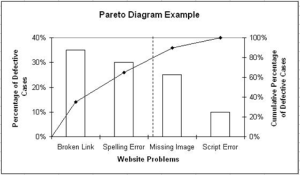
 Remember the Pareto Principle states that 80 percent of the problems come from 20 percent of the causes. In general, this means that addressing the problem or cause represented by the tallest bar achieves better results than working on problems or causes represented by shorter bars. For example, a business used a check-sheet to keep track of errors on their website. The errors they were interested in tracking were; 1) broken links; 2) spelling errors; 3) missing images, and; 4) script errors. The business then used a Pareto chart, shown here, to rank the errors by frequency.
To Use The Pareto Analysis Tool
- Identify the causes or problems you’ll be ranking.
- Select the unit of measurement, such as cost, frequency, or percentage.
- Determine the time period in which you’ll record the measurements.
- Collect the data. You can use other techniques, such as check-sheets, for gathering information.
- Rank the results from left to right on the horizontal axis, starting with the tallest bar.
- Interpret the results. You’ll notice that the items with the highest priority appear on the left.
- Develop an action plan.
Use This Tool When
- You need to identify major causes of a problem.
- Your team needs to reach consensus on what the major causes of a problem are.
- You or your team needs to focus because resources are limited.
- You are ready for the first step of an improvement process.
- You can name more than one or two root causes.
To Learn More
We recommend the following three (3) books for those of you interested in learning more:
- The 80/20 Principle: The Secret to Achieving More with Less by Richard Koch.
- The Quality Toolbox by Nancy R. Tague.
- The Team Handbook Third Edition by Peter R. Scholtes, Brian L. Joiner, and Barbara J. Streibel.
Helpful Hints
Brainstorming is a very effective tool when you begin to use Pareto Analysis. You can, for example, brainstorm a list of problems that are occurring. Your list will give a place to start when you are deciding what data to gather.
 When you draw your Pareto chart, draw to scale each bar. Label the left vertical axis with the unit of measurement, and record your raw data on the left vertical axis. Show percentages on the right vertical axis. Make sure you’ve drawn both axes to scale.
Draw a line across the top of the bars showing the cumulative totals of the categories. Make sure to label all parts of the chart clearly.
About the Author:
Gabriel Najera is the president & founder of Najera Consulting Group. Gabriel is a frequent speaker to organizations and sought after advisor to corporate and nonprofit executives in developing a strategic thinking mindset.
Gabriel is available to speak to your organization. To inquire about scheduling Gabriel about an upcoming speaking engagement or to inquire about our consulting services, please click on this link.


I find the Pareto Principle to be quite interesting – that 80% of profit, or production comes from 20% work load or efforts or in your example the problems with a website. Although I am not sure how to connect it in other aspects that reside outside of the business realm, however I do agree that looking at the biggest issues and resolving them first is always the best route to go.